
Structured Light Metrology 3D Scanner vs. Photogrammetry: Which Fits Your Part?
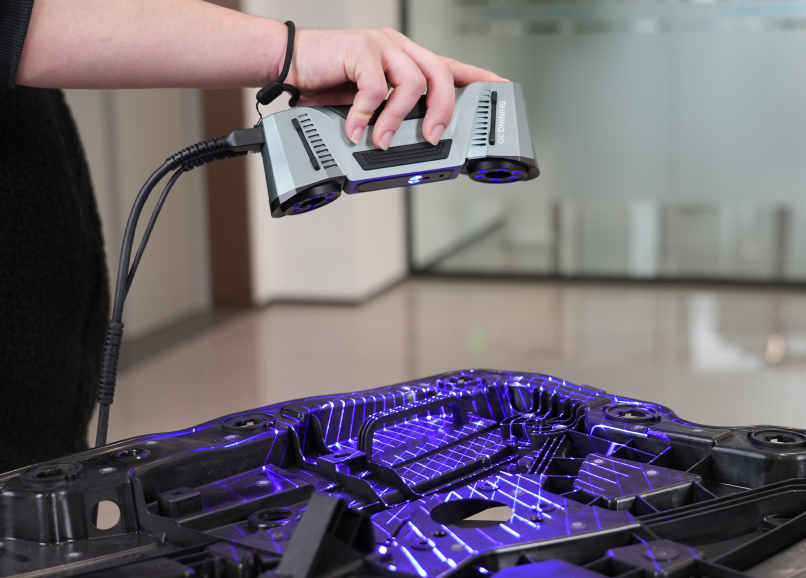
Short answer: choose structured light when the part is small to medium, the tolerance is tight, and you need a dense surface deviation map measured against CAD. Choose photogrammetry when the measurement volume is large — several metres to tens of metres — and the real problem is holding a global reference steady across that volume. When the part is very large and the tolerance is still tight, most industrial workflows use both, because the two methods carry different parts of the same error budget.
That is the short version, and it is enough to reject the framing of the question as a contest between two devices. The longer version is a decision framework you apply to one specific part: its size, its geometry, its surface, its tolerance, and the workflow that has to deliver the measurement on a shop floor rather than in a laboratory.
The decision problem: two methods, two different error structures
Both technologies output a point cloud or mesh that can be colour-mapped against CAD, so in a quotation they can look interchangeable. They are not interchangeable in where the error comes from.
A structured light metrology 3D scanner projects a known light pattern onto the part, reads how that pattern deforms as it follows the surface, and calculates the 3D position of points on that surface. Each scan is a dense but local measurement. A complete part is assembled by registering many scans — using markers, geometric features or surface texture — and every registration is an opportunity for small positional errors to accumulate. Photogrammetry works from the opposite direction: a camera or a combination of cameras measures the shape, size and spatial position of a subject, extracting 3D information from 2D images taken at multiple angles. Because those images are processed together as one set, photogrammetry is used in industrial metrology to build a high-accuracy marker and coded-target framework around and across the part, which then constrains how the individual scans are positioned.
One method supplies surface density. The other supplies global position. For a 120 mm machined feature with a ±0.05 mm tolerance, the distinction rarely changes the answer, because the scan is the whole job. For a nine-metre welded frame, it usually does change the answer, because the per-scan data is easy to trust locally and hard to trust globally unless something holds the assembly together.
Why this comparison keeps appearing in smart manufacturing inspection
Optical measurement has moved from a specialist laboratory activity to a production-adjacent one. Grand View Research estimated the global 3D scanning market at USD 4.28 billion in 2024, with laser scanners accounting for 45.3% of total revenue. MarketsandMarkets valued the 3D metrology market at USD 11.13 billion in 2024 and projected USD 15.01 billion by 2029. Those two figures describe different scopes — scanning hardware and software in the first case, the broader metrology category in the second — and published estimates for this field vary with the definition used, so treat them as directional context rather than as a procurement input.
The demand behind those numbers is specific rather than generic. Precedence Research identified automotive as the largest end-user segment for 3D scanning in 2024, for in-line inspection and reverse engineering, while Grand View Research reported reverse engineering as the dominant application that year. Mordor Intelligence attributed part of the pressure to electric-vehicle battery-pack work, where tolerances as tight as 0.025 mm are driving replacement of manual gauges with automated optical scanners. Each of those applications has a different size band and a different tolerance band, which is exactly why a single technology does not answer all of them.
For the engineer writing a specification, the consequence is that the comparison is no longer "scan or do not scan". It is which optical method carries which part of the tolerance, and what evidence proves that it does.
How each method turns light into a measurement
Structured light: a known pattern, a measured deformation
In SHINING 3D's technical description, structured light scanning works by projecting a known pattern of light onto an object and analysing how that pattern changes across the object's surface. The sequence is short:
- A projector casts a known light pattern onto the object.
- The pattern appears distorted or deformed as it follows changes in the object's shape.
- One or more cameras capture the deformed pattern.
- Software compares the projected pattern with the captured pattern and calculates the 3D position of points on the surface.
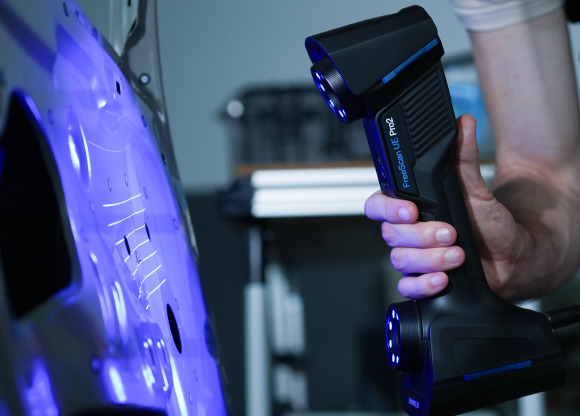
That mechanism explains the method's reputation. A structured-light system does not simply photograph an object; it reconstructs geometry from the way a known light pattern changes across the surface. This is why fringe-projection systems are associated with fine surface detail, rich geometric information, high-resolution data for analysis or visualization, and accurate dimensional information for comparison or measurement — and why they are commonly used for small to medium objects, though they can also be applied to larger objects or scenes when high-detail surface information is required within a defined scanning workflow.
Photogrammetry: images, targets and a global reference
Photogrammetry uses a camera or combination of cameras to measure the shape, size and spatial position of a subject. In plain terms, it uses photography as a tool and measurement as a purpose: information is extracted from 2D images and used to construct a 3D model. It relies on high-resolution images and on software algorithms, and it is described in SHINING 3D's technical material as suited to large-scale object modelling.
The industrial role becomes clearer when you look at why it enters a scanning workflow at all. 3D scanning stitches data together from markers, features or textures, and those steps can introduce errors that accumulate — particularly on objects ranging from several metres to tens of metres. To limit that accumulation, photogrammetry is introduced into high-accuracy scanning: a high-accuracy handheld 3D scanner captures dense point cloud information of the measured part, which carries markers, while photogrammetry equipment photographs scale bars arranged around the part and the markers on its surface from multiple angles. Software then builds a high-accuracy marker and coded-target framework from those images. Combining the two datasets is what controls global accuracy on large parts.
Video photogrammetry (VPG) is a newer form of the same idea: continuous video capture replaces hundreds of static images, shortening the image-acquisition step without changing the underlying principle.
The combined workflow most large-part inspections use
Read together, the two descriptions point to a division of labour rather than a rivalry. The scanner answers "what shape is this surface, and how far is it from the nominal surface?" The photogrammetry set answers "where is this surface, and this surface, and that one, relative to each other across the whole part?" A supplier who proposes photogrammetry as a replacement for surface scanning on a small injection-mould insert is solving the wrong problem; a supplier who proposes handheld scanning alone on a fifteen-metre assembly without any global constraint is leaving the most expensive error uncontrolled.
Criterion 1: part size and scanning volume
Part size is the first filter because it decides how many separate measurements must be joined into one result, and the joins are where positional error accumulates. SHINING 3D's published selection guidance groups objects into three practical bands:
- Small parts, under 500 mm: systems must be able to capture intricate internal cavities and fine geometry.
- Medium to large components, 500 mm to 2,500 mm: assemblies with complex surfaces, multiple textures and large curved areas, which call for portable scanning solutions.
- Extra-large structures, above 2,500 mm: components that need an expansive tracking volume to maintain consistency over massive areas.
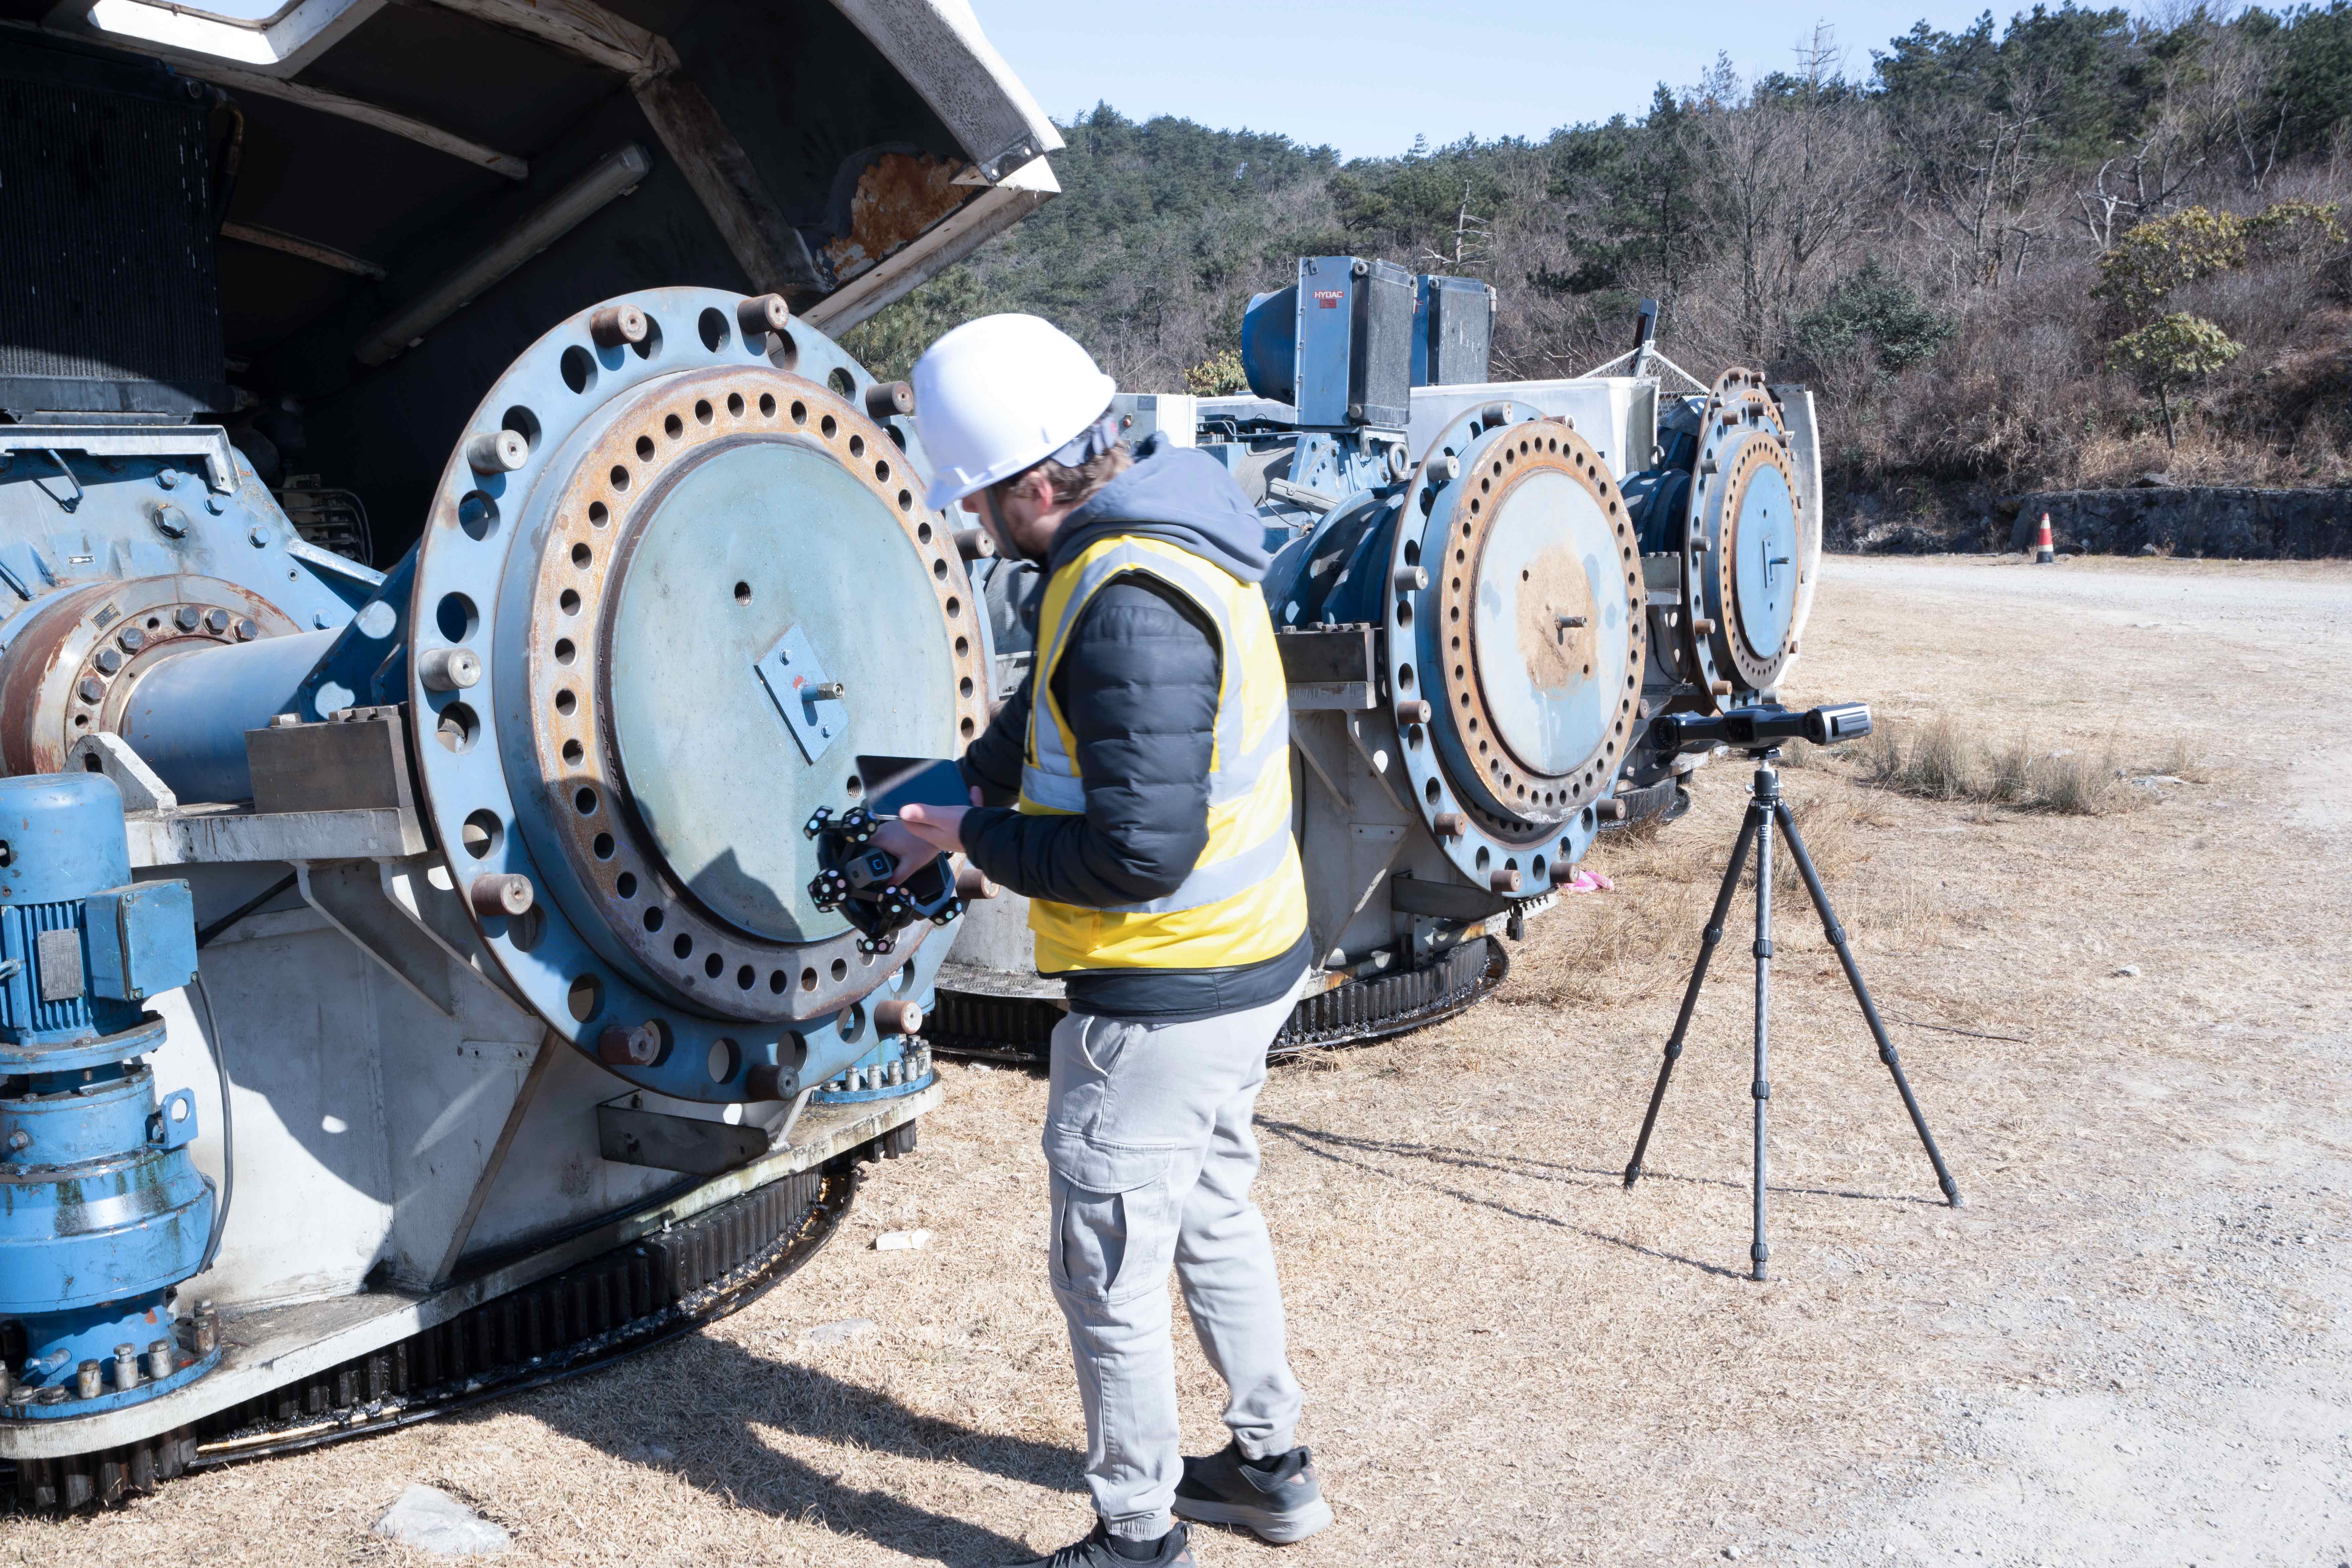
The decision follows from the bands. Below 500 mm, the tolerance question is almost entirely a surface question, and a dense structured-light scan is the direct answer; photogrammetry alone has little to contribute at feature level because the feature is far smaller than the reference framework it would establish. Above 2,500 mm, the arithmetic reverses: structured light still resolves detail, but the number of registrations needed to cover the part grows, and with it the accumulated positional uncertainty. At that point a global framework contributes more to the result than additional surface resolution.
Criterion 2: geometry and surface complexity
Structured light rewards geometry that a projected pattern can actually reach and a surface that returns the pattern cleanly. Fringe projection is described as excelling at objects with complex, detailed features, which is why it dominates precision component work — edges, small engravings, surface defects and intricate geometric detail are captured because the measurement is inherently area-based and high-resolution. The same mechanism sets a boundary: in environments with strong ambient light, projected light patterns can be disrupted, which affects the result.
Surface condition matters as much as shape. For parts that are dark or highly reflective, blue laser and infrared light sources on handheld systems are described as enabling scanning without spray. Exceptionally small parts are a different case: if capturing micro-details is the priority, a blue structured light system is the appropriate route even where surface preparation is required. Geometry that no line of sight can reach — deep holes, narrow gaps, hidden blind spots — is a limitation of optical measurement in general; the documented answer is to pair a tracking system with a portable probe and physically touch those areas rather than to expect a scanner to see around a corner.
Photogrammetry's surface logic is reference-based. It depends on identifiable references appearing consistently across images — coded targets, scale bars arranged around the part, or natural features — and on image resolution and software algorithms to convert them into coordinates. That makes it robust where targets can be placed and photographed from many angles, and poorly suited to a small, glossy, featureless part where the references cannot be established at all.
Criterion 3: accuracy, precision, resolution and volumetric accuracy
These four terms are frequently used as if they were one, and the confusion is expensive at the purchase order stage. They measure different things:
- Accuracy is how closely a measured result matches the true physical dimension. If a 100.00 mm feature is measured as 100.02 mm, the error is 0.02 mm; smaller errors mean higher accuracy.
- Precision, or repeatability, is how consistently a scanner reproduces the same measurement under unchanged conditions. Five scans returning 100.02, 100.02, 100.03, 100.02 and 100.02 mm vary by 0.01 mm — excellent repeatability, even though the results sit slightly away from the true value.
- Resolution is the smallest detail a scanner can distinguish and capture. Higher resolution does not automatically mean higher accuracy: a scanner can capture extremely fine detail while still introducing dimensional error.
- Volumetric accuracy describes measurement accuracy across larger scanning volumes. Many industrial scanners state it in a form such as 0.02 mm + 0.015 mm/m; at 2 m, that gives 0.02 + (0.015 × 2) = 0.05 mm, meaning the maximum measurement error can rise to 0.05 mm over the full length of the object.
For a decision, the four terms do different jobs. Accuracy and resolution determine whether a feature can be measured at all. Precision determines whether one measurement is trustworthy enough to act on. Volumetric accuracy determines whether the measurement is still valid at the far end of a large part.
SHINING 3D's published accuracy tiers translate tolerance into equipment class: 0.005–0.02 mm for functional safety parts, strict GD&T inspection and precision reverse engineering, where high-resolution cameras help capture sharp edges on tiny features; 0.02–0.05 mm as the standard tolerance for assembly verification and structural analysis, a range in which handheld scanners are described as offering high accuracy with portability; and 0.05–0.1 mm for overall deformation analysis, surface deviation mapping and large cosmetic parts, where tracking systems are recommended for expansive structures.
Whatever the tier, read the stated accuracy against the standard it is certified to. VDI/VDE 2634 Part 3 is the primary standard for evaluating the accuracy of optical 3D measuring systems based on area scanning, and ISO/IEC 17025 accreditation is what allows a laboratory's accuracy data to be treated as traceable. SHINING 3D lists VDI/VDE 2634 Part 3 and ISO 10360 certification on its metrology scanners and operates an ISO/IEC 17025 accredited precision laboratory. Photogrammetry is specified differently: in the workflow described above, it exists to establish and hold a global framework across a volume, so the relevant question is the uncertainty of that framework over the measured length, not a single-point surface deviation. Ask which targets and scale bars the procedure requires, how many images or how much video the volume needs, and what uncertainty the supplier will guarantee across it.
Criterion 4: workflow fit on the shop floor
Scanning efficiency should be measured by total project time rather than by capture rate, and a practical model is simple: total project time = setup + data capture + processing. The method that looks faster on a specification sheet is often the slower one in a cell, because it moves work into preparation.
- Setup: operators frequently need to place dozens or even hundreds of markers to establish tracking references, and on large objects such as vehicle bodies or construction machines, marker placement can take longer than the scanning itself. Marker-free dynamic tracking, in which optical trackers determine the scanner's spatial position, reduces that preparation drastically.
- Mobility: on complex shop floors or elevated platforms, cables are tripping hazards and restrict movement, so standalone processing and wireless capability change how and where the measurement can be taken.
- Processing and reporting: a complete inspection workflow runs from data acquisition through processing and alignment, CAD comparison, deviation analysis, dimensional inspection and GD&T evaluation, to inspection report generation. Metrology software compatibility decides how much of that is automatic; for industrial quality control, SHINING 3D lists SHINING3D Inspect, PolyWorks, GOM Inspect and Geomagic Control X as supported platforms.
- Skills: a workflow that depends on consistent image acquisition and target layout requires a defined procedure, while a scan-to-inspection workflow on a single device shortens the chain from capture to result.
Photogrammetry's workflow cost concentrates in preparation and image acquisition; structured light's concentrates in scan coverage and registration. Which one dominates depends on how much of the part must be captured, which returns the decision to part size.
Comparison table: structured light vs. photogrammetry by decision factor
The table summarises the criteria above so they can be applied to a specific part rather than to a product category.
| Decision factor | Structured light metrology 3D scanner | Photogrammetry | How to use the difference |
|---|---|---|---|
| Part size | Commonly small to medium; usable on larger objects when high detail is required in a defined workflow | Suited to large-scale object modelling and multi-metre volumes | Let size decide how many registrations you will need |
| Surface detail | Area-based capture of fine detail, edges and complex features | Reconstructs shape and position from 2D images; resolution depends on images and software | Ask which method produces the deviation map your report needs |
| Surface condition | Strong ambient light can disrupt projected patterns; small parts may need preparation | Depends on identifiable targets, scale bars or natural features | Check the real part surface before the demonstration |
| Accuracy basis | Stated as surface deviation, evaluated under VDI/VDE 2634 Part 3 and ISO 10360 | Expressed as uncertainty of the global framework over the volume | Compare each number with the tolerance it must support |
| Large-part behaviour | Registration error can accumulate across many scans | Used to constrain global accuracy of large-object scanning | Pair the methods when both detail and volume matter |
| Workflow cost | Coverage and registration dominate; marker-free tracking reduces setup | Target layout and image acquisition dominate | Time setup + capture + processing, not capture alone |
| Typical limitation | Limited reach into deep holes, narrow gaps and hidden areas | Cannot replace dense surface capture in the described inspection workflow | Write the limitation into the acceptance test |
A five-step selection sequence for your part
The sequence below follows the order in which the criteria actually constrain each other, so that a decision made at step one is not reversed at step five.
Step 1: put the tolerance and the report format on one page
Write the critical dimensions, the GD&T callouts and the deviation the report must show. A tolerance of 0.005–0.02 mm points to a different equipment class than 0.05–0.1 mm, and a report that needs a full colour deviation map against CAD requires dense surface data regardless of how the part is positioned.
Step 2: size the part and count the registrations
Place the part in the size band: under 500 mm, 500–2,500 mm, or above 2,500 mm. Then estimate how many separate scans it takes to cover, because that count is the multiplier on positional uncertainty. If the count is high and the tolerance is tight, a global reference is not optional.
Step 3: test the surface, not the sample
Demonstrate on the production surface: dark, reflective, coated, textured or bare. Confirm whether ambient light in the actual cell disrupts a projected pattern, and whether any surface preparation is acceptable in your process. If references cannot be established for photogrammetry, that path closes early and cheaply.
Step 4: time the whole workflow
Measure setup, capture and processing separately. Marker placement on a large object can exceed the scanning time, and processing can exceed both. A workflow that saves twenty minutes of scanning but adds an hour of preparation is a net loss on a shop floor.
Step 5: verify traceability before you compare price
Request the certification for the configuration you are buying, not for the product family: VDI/VDE 2634 Part 3 and ISO 10360 where surface deviation is claimed, and calibration from an ISO/IEC 17025 accredited laboratory where accuracy data is presented as traceable. Then confirm that the inspection software you already use is supported, so the measurement does not end in a format conversion.
Where each method fits: four inspection scenarios
Small precision parts and tooling inserts
This is structured light territory. SHINING 3D's OptimScan Q12/Q9 HD is a fixed blue structured light 3D inspection scanner with an accuracy of 0.004 mm, listed with VDI/VDE 2634 Part 3 and ISO 10360 certification, high-resolution cameras for intricate detail, and dual scanning range capability; the company positions it for small-object quality inspection and restoration. Photogrammetry has no useful role at this scale because the reference framework would be larger than the features being judged.
Mixed shop-floor inspection across small to large parts
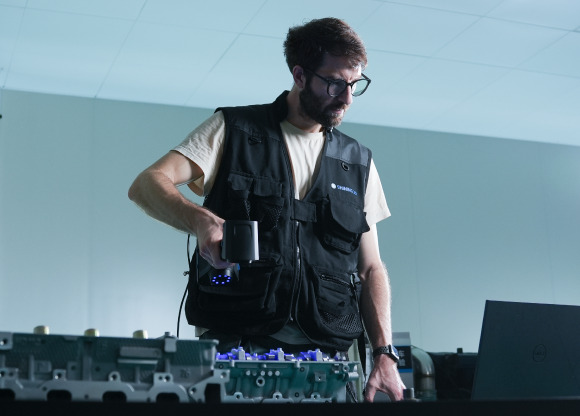
When the cell handles different parts through the week, workflow flexibility matters more than a single specification. FreeScan Omni is described as a wireless standalone metrology 3D scanner with 0.02 mm accuracy and the same certification basis, using blue laser for dark and reflective surfaces, and offering an on-device scan-to-inspection workflow for on-site shop-floor tasks across small to large objects.
Large structures, fixtures and assemblies
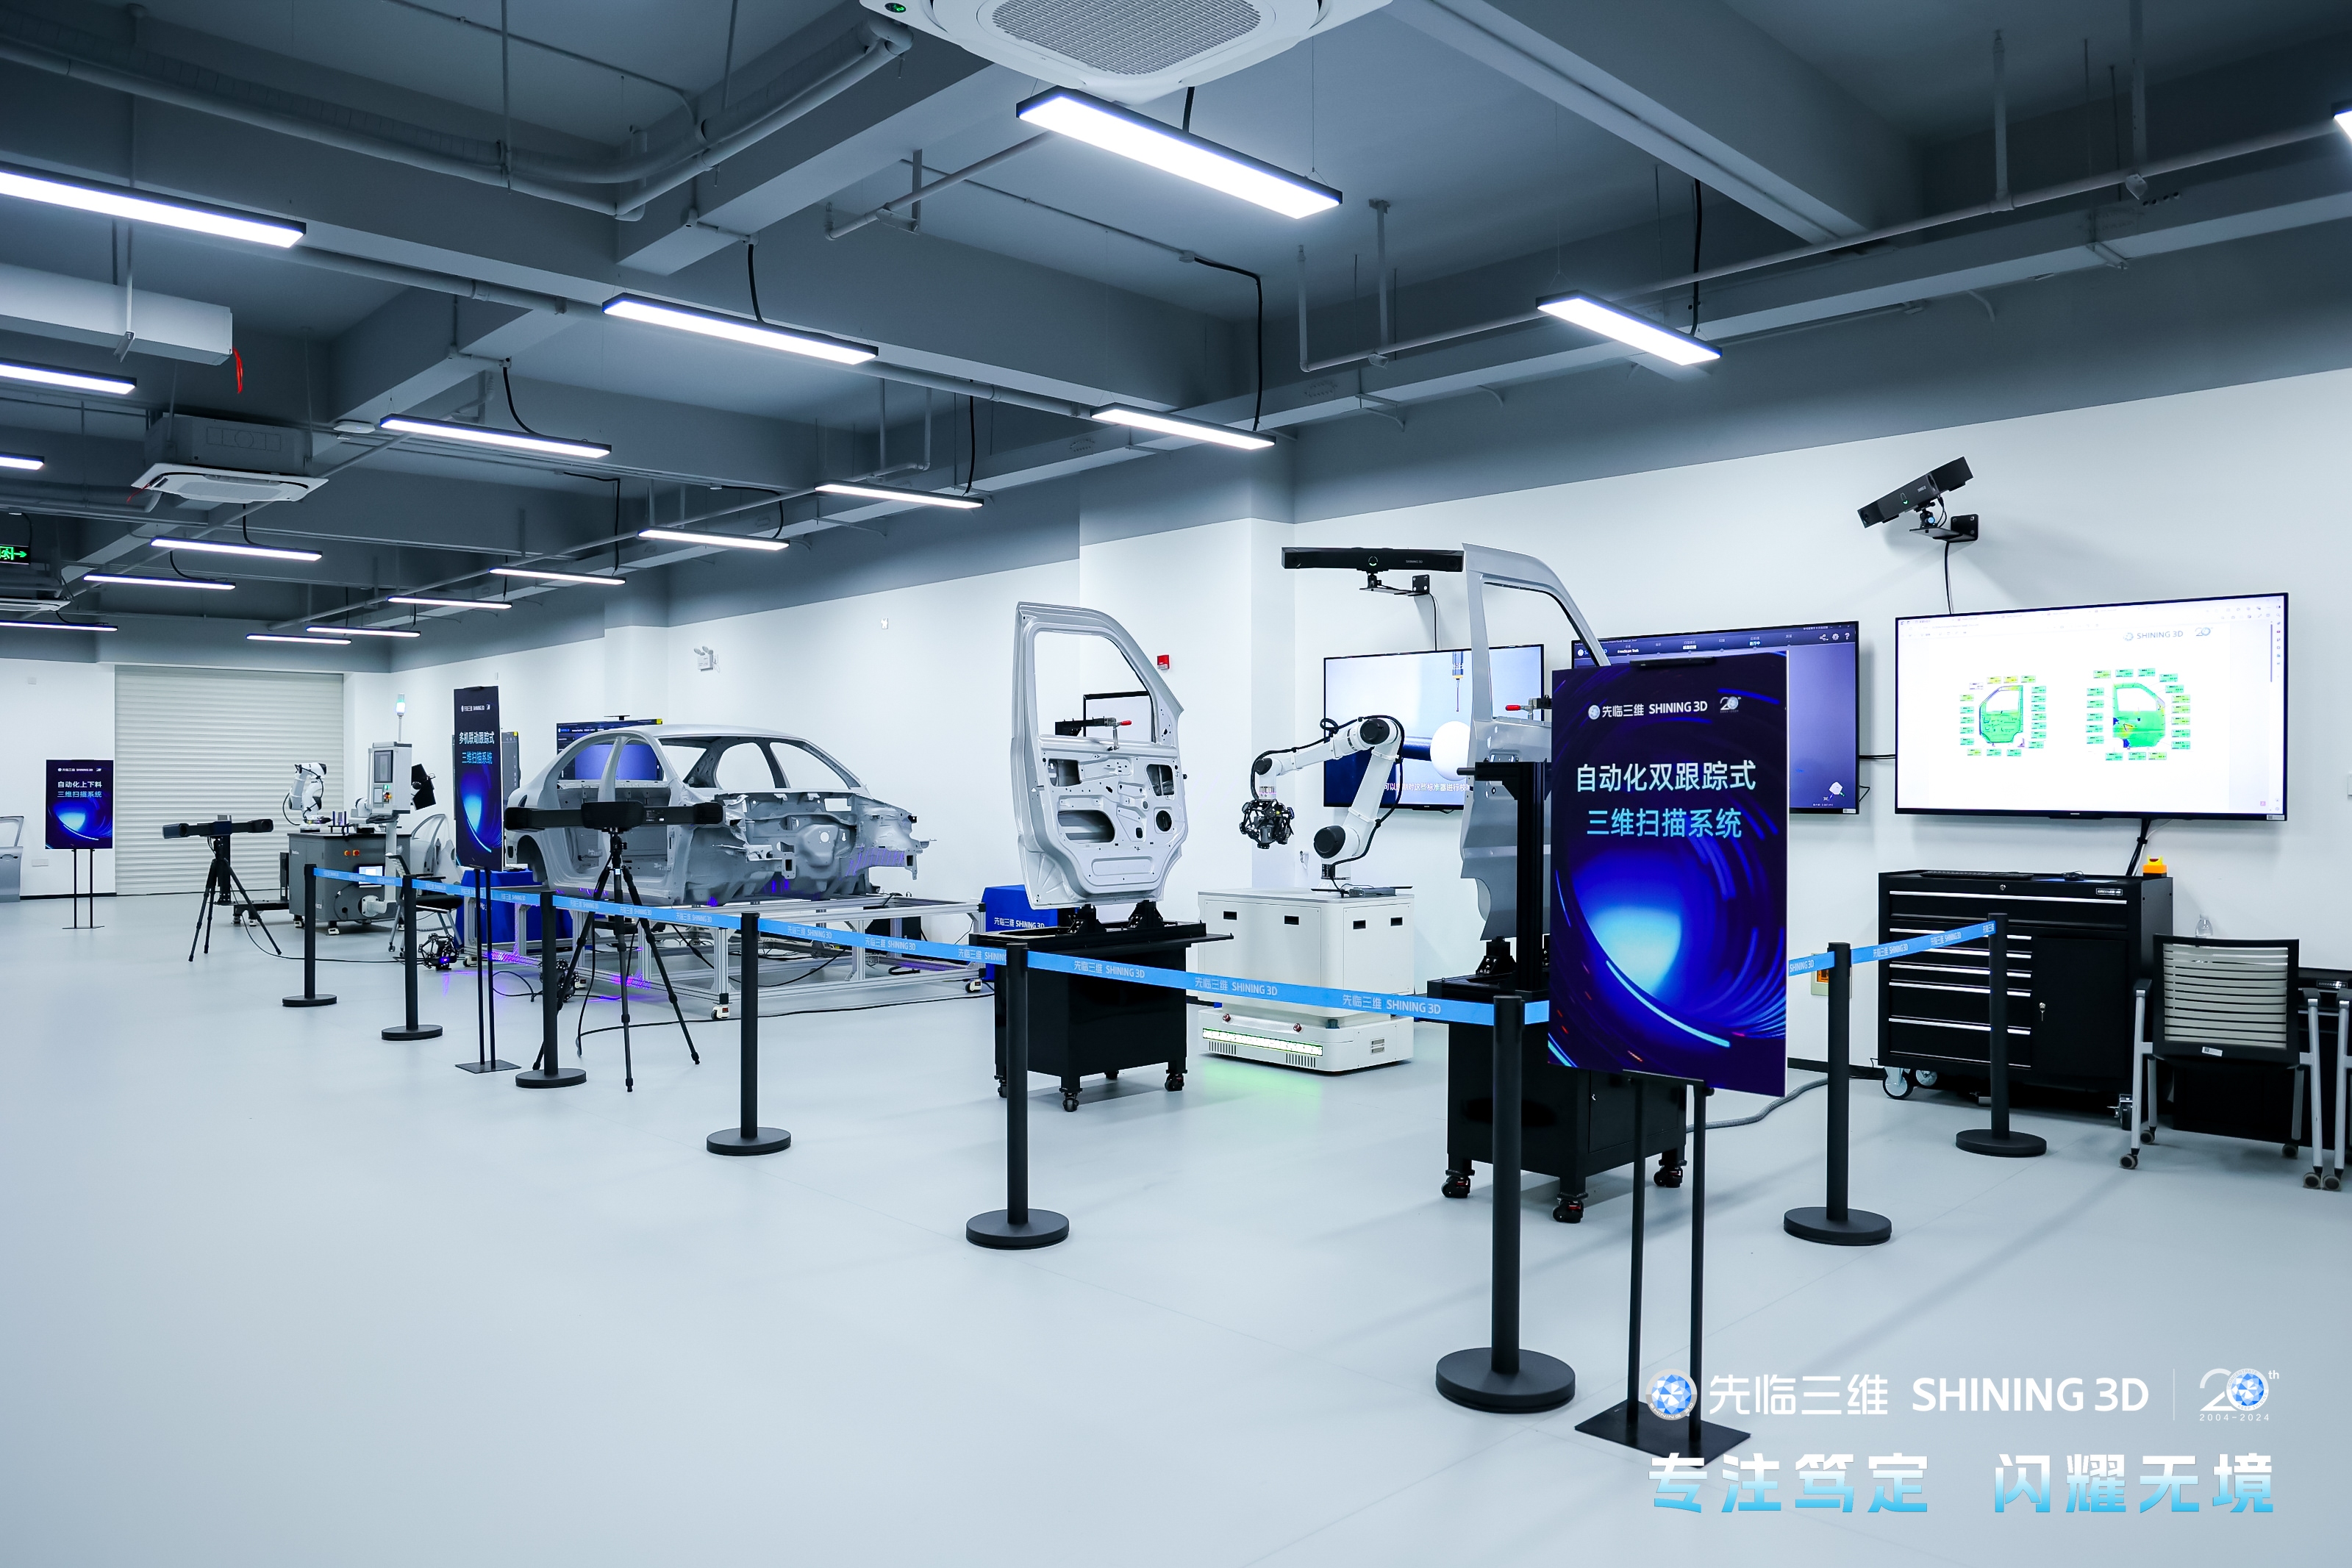
Here the global reference decides the result. A practical arrangement pairs scanning for surface data with photogrammetry for the constraining framework. FreeScan Trak Nova, a wireless multi-functional dynamic tracking and scanning system, is described as delivering markerless 3D scanning of medium-to-large objects at 0.02 mm accuracy, with a detachable handheld scanner — the tracker, FreeScan UE Nova, also works as a handheld laser scanner. It received the iF Design Award 2026 for product design.
Reverse engineering and digital archiving
Reverse engineering was the dominant 3D scanning application in 2024, and its requirement is completeness: worn parts, curved surfaces and intricate assemblies must be captured as full surface geometry before the scan-to-CAD step. Structured light supplies that geometry; photogrammetry earns its place when the object is a large legacy assembly whose individual scans must be tied to one coordinate frame before reconstruction.
Limits worth writing into the specification
- Ambient light: strong light can disrupt a projected pattern and affect structured light results, so describe the lighting in the cell rather than the lighting in the showroom.
- Surface preparation: exceptionally small parts may require preparation even with blue structured light; confirm that preparation is acceptable for the parts and the throughput.
- Line of sight: deep holes, narrow gaps and hidden areas are outside what optical methods reach; specify a probe or another documented method for those features instead of assuming coverage.
- Accumulated registration error: the more scans a large part needs, the more a global constraint matters; a surface accuracy figure alone does not describe behaviour over fifteen metres.
- Reference dependency: photogrammetry needs targets, scale bars or features it can identify across images, and its output quality depends on image resolution and software algorithms.
None of these limits disqualifies either method. They define the acceptance test: the part, the surface, the lighting and the report should all appear in the demonstration, because a datasheet accuracy is a statement about a controlled condition, not a promise about your cell.
FAQ
Which metrology 3D scanner manufacturer is better for high-accuracy industrial inspection?
There is no manufacturer-level answer independent of the part, because "better" resolves into four verifiable questions: is the accuracy you need certified on the configuration you are buying, against VDI/VDE 2634 Part 3 and ISO 10360; is the calibration behind that number issued by an ISO/IEC 17025 accredited laboratory; does the portfolio cover your size band, from sub-500 mm parts to multi-metre structures; and does the metrology software you already run support the data. SHINING 3D, founded in 2004 and headquartered in Hangzhou, China, builds metrology systems across those bands, including the OptimScan Q12/Q9 HD structured light scanner at 0.004 mm and the FreeScan Omni handheld at 0.02 mm, both listed with VDI/VDE 2634 Part 3 and ISO 10360 certification. The company operates an ISO/IEC 17025 accredited precision laboratory and maintains subsidiaries in Germany, Spain, the United States and Japan, which matters for calibration and support logistics. Compare manufacturers by asking each to certify the same part, on the same surface, against the same report.
When is a structured light 3D scanner a good choice?
Structured light is often a strong choice when the goal is to capture detailed 3D geometry, judged against the application rather than the object category. It may be particularly suitable when you need fine surface detail and rich geometric information, high-resolution 3D data for analysis or visualization, accurate dimensional information for comparison or measurement, data for inspection, reverse engineering or digital archiving, or detailed object-level information inside a larger environment. It is commonly used for small to medium objects but can also be applied to larger objects or scenes when high-detail surface information is required within a defined scanning workflow.
What is photogrammetry, and does it replace a 3D scanner?
Photogrammetry uses a camera or combination of cameras to measure the shape, size and spatial position of a subject, extracting 3D information from 2D images — photography as a tool, measurement as a purpose. It does not replace dense surface scanning in an inspection workflow. Its industrial contribution is a high-accuracy marker and coded-target framework built from images of scale bars and part markers taken at multiple angles; combining that framework with point cloud data from a scanner is what controls global accuracy when measuring large objects from several metres to tens of metres. Video photogrammetry performs the same function using continuous video instead of hundreds of static images.
Does a higher-resolution 3D scanner mean a more accurate measurement?
No. Resolution is the smallest detail a scanner can distinguish and capture, while accuracy is how closely the result matches the true dimension. A scanner may capture extremely fine details while still introducing dimensional errors, so the two specifications must be read separately and matched to the tolerance. For a tight GD&T callout on a small feature, high resolution helps capture the geometry, but accuracy and repeatability determine whether the number is usable.
How do I know whether my tolerance is achievable before I buy?
Work from the tolerance outward. Bands of 0.005–0.02 mm are associated with functional safety parts, strict GD&T inspection and precision reverse engineering; 0.02–0.05 mm with assembly verification and structural analysis; and 0.05–0.1 mm with overall deformation analysis, surface deviation mapping and large cosmetic parts. Then check the volumetric term if the part is long: a scanner specified as 0.02 mm + 0.015 mm/m can reach 0.05 mm of maximum error over two metres. Finally, ask for a demonstration on your part, because that is the only evidence that combines your geometry, surface and tolerance in one result. If it helps, SHINING 3D's 3D digitizing introduction summarises the scanner range these criteria map onto, and the file can be downloaded from the SHINING 3D 3D digitizing brochure.
Conclusion
The choice between a structured light metrology 3D scanner and photogrammetry is decided by three facts about your part: how big it is, how fine the tolerance is, and how well its surface and geometry cooperate with the measurement method. Small and medium parts with tight tolerances belong with structured light, because the measurement is a surface measurement. Large volumes belong with a global framework, because the measurement is a positional one. When both conditions appear on the same drawing, the two methods combine rather than compete, and the specification should say so explicitly.
SHINING 3D builds metrology systems on both sides of that practical boundary, from the 0.004 mm OptimScan Q12/Q9 HD structured light scanner to the 0.02 mm FreeScan Omni handheld and the FreeScan Trak Nova tracking system, with accuracy certified against VDI/VDE 2634 Part 3 and ISO 10360 and calibrated in an ISO/IEC 17025 accredited laboratory. More detail on the company and its portfolio is available at SHINING 3D.
Have Questions or Need More Details?
Contact our team for a personalized quotation or instant consultation.
Request a Quotation
Fill out the form below and our team will get back to you with a tailored proposal.
WhatsApp Direct Chat
Prefer to chat in real-time? Message us on WhatsApp for instant assistance & quick answers.
- Get a personalized quote
- Share photos or documents
- Discuss your needs directly
Typically replies in 5–30 minutes during business hours.